2023 Rental Vacancy Rates by City and State
Our analysis of U.S. Census Bureau housing data reveals rental vacancy rates have hit near-record lows. How does the rental housing availability in your city and state compare?

The vacancy rate for residential rental properties in the U.S. is at its lowest point in 38 years. Not since early 1984 has the rental vacancy been below the 5.6% rate registered in the second quarter of 2022.
While a very high rental vacancy rate can indicate other local economic hardships, an extremely low rental vacancy rate can signal a scarcity of affordable housing options for many Americans.
A shortage of available rental units is particularly evident in certain cities and states. We analyzed housing vacancy data from the U.S. Census Bureau to identify the areas of the U.S. with the lowest rental vacancy rates and the areas that are trending quickly in that direction.
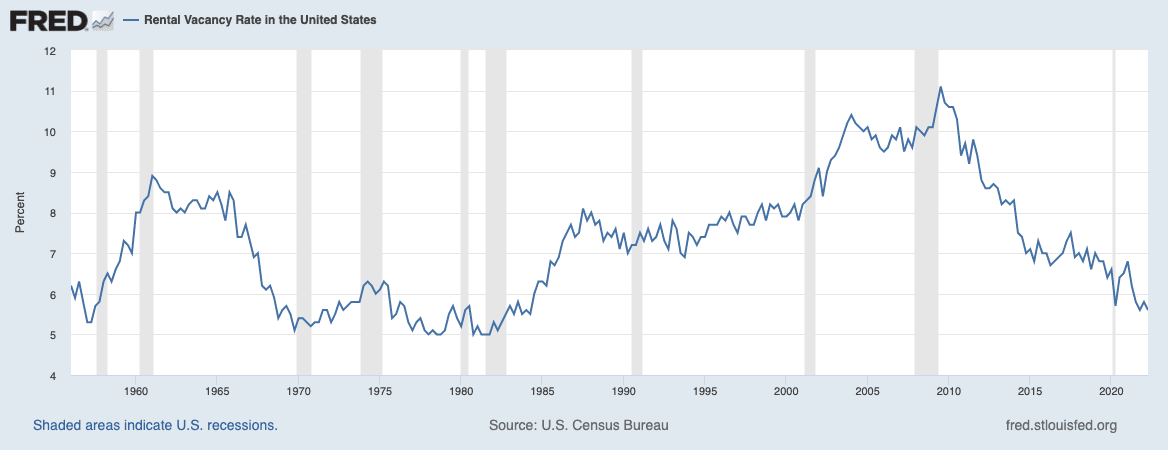
Source: Federal Reserve Bank of Illinois. (Aug. 2022).
Approximately one out of every 16 rental units in the U.S. sat unoccupied during the second quarter of 2022.
The chart below shows the vacancy rates for rental units in each state during the first half of 2022 along with how the annual rates changed from 2015 to 2021. The vacancy rate ranged from 2.1% in Connecticut to 11% in North Dakota.
Click on image to enlarge in a new tab

A few data highlights include:
- North Carolina saw the biggest decrease in vacancies from 2015 (9.8%) to 2021 (5.3%). Nevada also saw a significant drop in vacancies from 2015 to 2021 that continues through early 2022.
- New Mexico’s vacancy rate fell sharply from 2015 to 2021 and has only continued in the same direction. Alabama’s vacancy rate plunged from 14.9% in 2015 to 11.7% in 2021 and then to 6.9% during the second quarter of 2022. Louisiana, Ohio and Michigan have been on a similar path.
- The District of Columbia had the steepest increase in vacancies during the study period, increasing from 5.4% in 2015 to 9.8% in 2021. The rate has since dropped slightly and registered 8.5% in Q2 2022.
- North Dakota also saw a sharp increase in vacancies between 2015 and 2021, though the rate has dipped slightly in 2022. Iowa shares a similar trajectory.
- South Dakota’s vacancy rate also shot up between 2015 and 2021 but has made a sharp turn in 2022 and reached a level below that of the state’s 2015 rate.
Vacancy rate data is available for 75 large cities and metro areas that combined for a rental unit vacancy rate of 5.7% during the second quarter of 2022.
The chart below shows the vacancy rates for the second quarter of 2022 along with how the annual rates fluctuated between 2015 and 2021.
Click on image to enlarge in a new tab
The 2022 rental vacancy in June 2022 registered below 2% in:
- Richmond, VA
- Rochester, NY
- Bridgeport, CT
- New Haven, CT
- Grand Rapids, MI
- Sacramento, CA
At 21.2%, Fort Myers leads the nation in city rental vacancy rates by a stark margin, more than twice the rate in all but three other U.S. cities. The 13.6% rental unit vacancy rate in Toledo, OH, is second highest in the nation.
- Sacramento’s 0.9% vacancy rate in Q2 2022 is far below California’s statewide average of 4.1%.
- The Grand Rapids area of Michigan also has a rate of available rental units (1.3%) is well below that of the state as a whole (5.2%).
- Raleigh, NC has also undergone a dramatic shift in the early goings of 2022. The vacancy rate there averaged just 2.9% in 2021 ended the second quarter of 2022 with an 8.0% rate.
- In nearby Greensboro, NC, the vacancy rate plummeted from 9.1% in 2015 to 2.9% in 2021, representing one of the steepest drop-offs in vacancy rate among larger cities during that time.
The largest drop in vacancy rate between 2015 and 2021 was in Akron, OH, where empty rental units went from 12.1% to just 0.7% over a six-year period. The area market has since bounced back and posted a rate of 3.2% for the first half of 2022.
Ideally, a particular city or state would have a vacancy rate that is not too high nor too low.
- A low vacancy rate means fewer options and typically higher prices for those looking to rent. When the vacancy rate is low, potential renters are competing against each other for units and landlords will often increase the price to find the highest bidder.
This not only affects the cost of those units in particular but may also have a trickle-down effect on the rest of the local market, as landlords typically price their units in accordance with local competition. - A high vacancy rate generally means more competitive pricing for renters but runs the risk of units falling into disrepair after lengthy stretches of vacancy.
Too much supply with too little demand has contributed to hollowed-out neighborhoods full of abandoned buildings that would cost more to repair than what they are worth.
Neither extreme is good for all parties involved – landlords, renters and the community at large. The nonprofit advocacy organization Strong Towns speaks of the “Goldilocks” solution that places a community’s vacancy rate somewhere in the middle of the two extremes.
Reasons for fluctuations in rental vacancy rates vary, but the current rates may be partly explained by three factors:
- The housing crisis and resulting recession that began in 2007 led to tighter restrictions for securing a mortgage loan. Many would-be buyers have since been forced to rent instead, with homeownership rates falling from their pre-recession peak.
- The cost of homes rose faster than ever before in 2021, with the median price of a home increasing 17% from 2020. Many would-be buyers have been priced out of buying and continue to rent.
- The inventory of homes for sale hit an all-time low in December of 2021, limiting options for renters looking to buy and instead keeping them put.
Rental vacancy rates vary across cities and states. Tighter mortgage restrictions, rising home costs and record-low home inventory may all be playing roles in high occupancy rates among residential rental units.
The data used for this report came from the U.S. Census Bureau’s Housing Vacancies and Homeownership (CPS/HVS) Survey, specifically the Quarterly Vacancy Rates report including second quarter 2022, the most recent data available.