Our analysis of the most recent CDC data reveals how many people in the U.S. can’t afford to see a d...
Analysis of the latest U.S. Census Bureau data finds 24% of U.S. adults affected by the disease have experienced COVID-19 symptoms for three months or longer. Learn which state and major metro area populations are experiencing the highest rates of long COVID.
![Umbraco.Cms.Core.Models.MediaWithCrops`1[TzDigitalUmb.HelpAdvisor.Web.ContentModels.Image]](https://res.cloudinary.com/tranzact/c_fill,g_faces:center,h_300,w_700/f_auto,q_auto,c_limit,w_2000,h_2000/f_auto,q_auto,c_limit,w_2000,h_2000/v1/Umbraco/tz-helpadvisor/nurse-wearing-a-mask-takes-blood-for-patient)
Most people who come down with COVID-19 symptoms are back on their feet within a week or two. But a staggering 24% of U.S. adults who received a positive COVID-19 test or diagnosis report symptoms that lasted three months or longer.
That’s according to our analysis of November data from the U.S. Census Bureau Household Pulse Survey. In this report, we highlight the states and major cities where the highest percentages of residents report the effects of long COVID.
The World Health Organization (WHO) defines long COVID as “the continuation or development of new symptoms three months after the initial SARS-CoV-2 infection, with these symptoms lasting for at least two months with no other explanation.”
The table below shows the percentage of adults in each state who have tested positive or been diagnosed with COVID-19 and have experienced symptoms lasting longer than three months.
Click on image to enlarge in a new tab

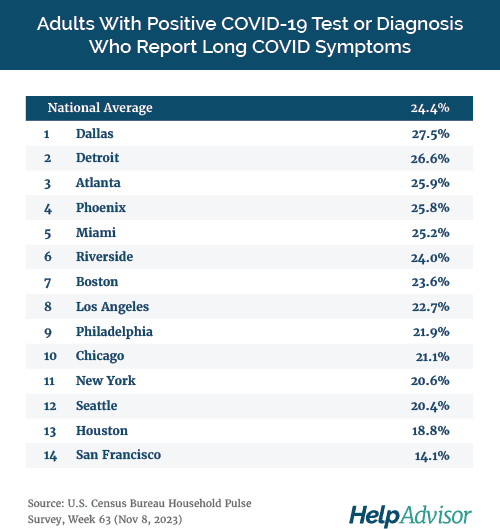
The table below shows the percentage of adults reporting long COVID in the 14 largest major metropolitan statistical areas (MSAs).
Click on image to enlarge in a new tab
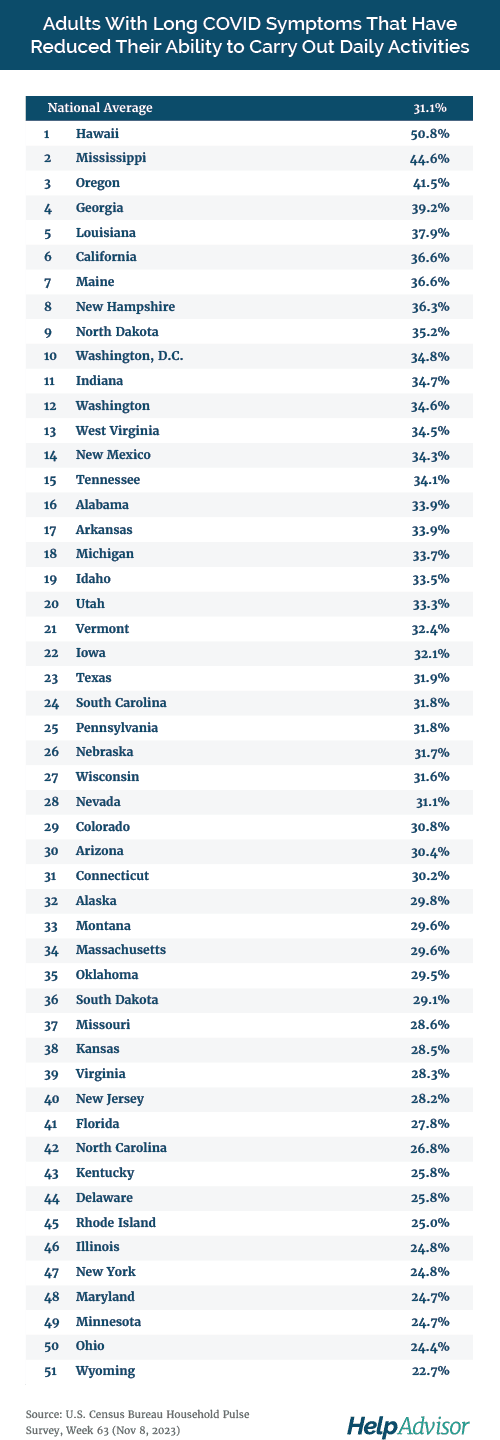
Nearly one out of three people who reported suffering from long COVID said their symptoms have reduced their ability to carry out daily activities.
More than half of those with long COVID in Hawaii reported difficulty carrying out daily activities, and more than two out of five long COVID sufferers in Mississippi and Oregon reported the same.
The table below shows the percentage of people with long COVID in each state who said their symptoms have reduced their ability to carry out daily activities.
Click on image to enlarge in a new tab
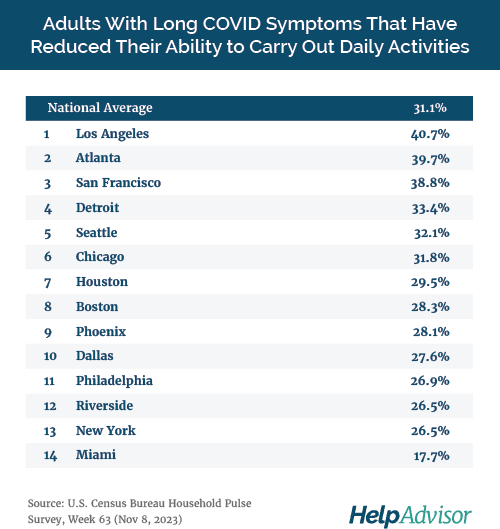
Similarly, the table below shows the rates of adults with long COVID in 14 major metro areas who said their symptoms have reduced their ability to carry out daily activities.
Click on image to enlarge in a new tab
A 2022 study from Brookings found that long COVID could be responsible for keeping as many as four million people out of work, or roughly 15% of the labor shortage.
The total economic cost of long COVID has been estimated to be as high as $3.7 trillion, or 17% of the 2019 U.S. gross domestic product (GDP).
It’s not yet known what causes long COVID, but researchers do have some clues. Potential causes include:
Symptoms of long COVID, also called Post-COVID Conditions (PCC), can include:
Those who suffer from long COVID are often referred to as “long haulers,” and according to the CDC, studies have shown certain groups of people may be at an increased risk:
Studies have found depleted serotonin levels in long COVID patients, which may be a cause of the “brain fog,” or neurocognitive difficulties that many people with long COVID report. Other studies have pointed to a link between COVID-19 infections and accelerated brain deterioration among those with dementia.
The data used for this report came from the U.S. Census Bureau Household Pulse Survey, specifically Week 63 (Nov 8, 2023), the most recent data available.